Monday, August 30, 2010

Create LiDAR point density map with SAGA GIS

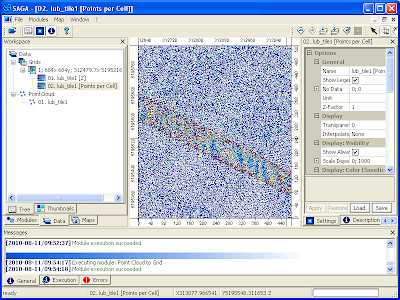
I am finding SAGA GIS to be quite useful and powerful in processing LiDAR data. One of the typical task is to determine the point density of a LiDAR survey. Usually this is in the form of a text report showing the file or tile and the calculated LiDAR point density i.e. the number of points per square meter. Some reports will even show the minimum, maximum and average values. I have used SAGA GIS to create a graphical point density map as shown in the figure below.


The steps to create the point density map are described below.

Import LiDAR LAS file

  1. Start up SAGA GIS.
  2. Select Modules | File | Shapes | Import | Import LAS Files.

    The Import LAS Files dialog box appears.

  3. Click the Input File row. Click the [...] button on the right.

    The Open dialog box appears.
  4. Browse and select a LAS file, e.g. lub_tile1.las. Click Open.

    The selected file name is displayed in the Import LAS Files dialog box.

  5. If necessary to filter the LiDAR points by attributes, toggle on any Attributes to import besides x,y,z ... e.g. classification. Click Okay.

    The LAS file is imported into SAGA GIS.

    Note: click the Data tab of the Workspace pane to see the imported point cloud in the Data tree.
Use Convert Point Cloud to Grid Module to generate the Points Per Cell grid
  1. Select Modules | Shapes | Point Clouds | Conversion | Point Cloud to Grid.

    The Point Cloud to Grid dialog box appears.
  2. Click the Points row drop down list and select the previously import LAS file, e.g. 01.lub_tile1.
  3. In the Cellsize field, type in the desired output grid cell size e.g. 1.


  4. Click Okay.

    The conversion has created two grid layers containing Z as well as Points per Cell values.
Each cell in the Points per Cell grid layer contains the number of LiDAR points in that cell. If the cell size you chose was 1 meter, then the cell value is directly the point density per square meter and you don't have to do any further grid calculation to get the final value. If you want to calculate the point density per classification, then prior to running the Point Cloud to Grid module, you have to filter out the Point Cloud first. 

Display the Points per Cell grid layer
  1. In the Data tree, right click on the Points per Cell grid layer created previously, e.g. 02.lub_tile1[Points per Cell].

    A pop up menu appears.
  2. Choose Show Grid.

    The grid layer is displayed.
  3. On the right pane, click the Legend tab.

    The legend of the point density is displayed.

    Note: the blues have the lowest density (less than 1.2 points per square meter) while the reds have the highest density (more than 5.2 points per square meter)

Monday, August 23, 2010

Create a bare earth DTM from a classified LiDAR LAS file with SAGA GIS

A LiDAR LAS file can have its point clouds classified under a few standard classes e.g. Ground, Low Vegetation, Building, etc. For generating a bare earth digital terrain model (DTM) without vegetation and structures, only the points classified as Ground class are necessary. An example is shown below.

It is relatively straightforward to use SAGA GIS to import the LiDAR LAS file, to extract out a subset containing only the ground points, and then to interpolate the points into a bare earth surface model. I tried out the following steps to create an ESRI ArcGrid ASCII file of the bare earth ground surface.

Import the LiDAR LAS file

  1. Start up SAGA GIS. Select Modules | File | Shapes | Import | Import LAS Files.

    The Import LAS Files dialog box appears.
  2. Select the Input File row. Click the [...] button on the right. In the Open dialog box, browse and select the LAS file, e.g. lub_tile1.las. Click Open.

    The selected file name is displayed in the Import LAS Files dialog box.
  3. In the Attributes to import besides x,y,z list, toggle on classification and any other attributes you want.


  4. Click Okay.

    The LAS file is imported into SAGA GIS.
Extract out Ground points
  1. Select Modules | Shapes | Point Clouds | Tools | Point Cloud Reclassifier / Subset Extractor.

    The Point Cloud Reclassifier / Subset Extractor dialog box appears.

  2. Click the Point Cloud row. Choose the newly imported point cloud in the drop down list, e.g. 01.lub_tile1.
  3. Click the Point Cloud Attribute row. Choose classification.
  4. In the Mode of operation row, choose Extract Subset.
  5. In the Method single old value row, type in 2 for Ground class.
  6. In the Method single new value row, type in 2 to keep it the same value in the subset.


  7. Click Okay.

    The point cloud subset of only Ground points is created. By default, the new layer will have the string subset_classification appended to the input name.
Interpolating the bare earth ground surface
  1. Select Modules | Grid | Gridding | Interpolation from Points | Triangulation.

    The Triangulation dialog box appears.
    Note: Other interpolation algorithm is also fine depending on your requirements
    .
  2. In the Points row, choose the newly created subset e.g. 02.lub_tile1_subset_classification.
  3. In the Attribute row, choose Z.


  4. Click Okay.

    The User Defined Grid dialog box appears.
  5. Optional. In the Cellsize row, type in the desired output cell size e.g. 1.


  6. Click Okay.

    The grid layer is created.
Exporting the bare earth surface in ESRI ArcGrid ASCII format
  1. Select Modules | File | Grid | Export | Export ESRI Arc/Info Grid.

    The Export ESRI Arc/Info Grid dialog box appears.

  2. In the Grid system row, choose the grid system of the bare earth surface grid layer, e.g. 1;684x 685y; 312479.7x 5195216.9y.
  3. In the Grid row, choose the bare earth grid layer, e.g. 01.lub_tile1_subset_classification(Triangulation).
  4. In the File row, click the [...] button. Browse and specify the output file name, e.g. C:\Temp\dtm.asc. Click Save.


  5. Click Okay.

    The bare earth ground surface is exported out.

Tuesday, August 17, 2010

Visualize terrain with hill shading in SAGA GIS

By default, SAGA GIS displays grid data with a graduated color table as shown below.

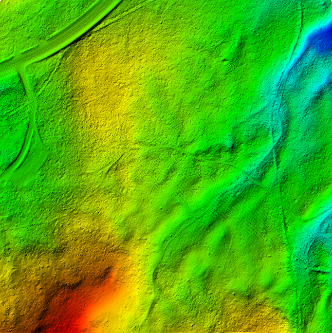
For non-terrain grid data, this is quite okay. When viewing terrain grid data, it is more intuitive to the eye to provide some indications of the 3rd dimension in the planar map view as shown below.

Unlike Global Mapper, a separate hill shade grid layer must be generated explicitly and then overlaid and blended with the terrain layer. This behavior is similar to GeoMedia Grid, another generic grid analysis software. The following paragraphs describe the steps that I did.

Load in a terrain grid file (ESRI ArcGrid ASCII)

  1. Start up SAGA GIS. Select Modules | File | Grid | Import | Import ESRI Arc/Info Grid.

    The Import ESRI Arc/Info Grid dialog box appears.

  2. Click the File row. Click the [...] button on the right.

    The Open dialog box appears.
  3. Browse and select an existing ESRI ArcGrid ASCII file, e.g. elev.asc. Click Open.

    The selected file name is displayed in the Import ESRI Arc/Info Grid dialog box.

  4. Click Okay.

    The selected file is imported into SAGA GIS.
Displaying the elevation grid
  1. Click the Data tab of the Workspace pane on the left.

    The data tree view is displayed.
  2. In the data tree view, select the newly import elevation grid. Right click.

    A pop up menu appears.

  3. Choose Show Grid.

    The elevation grid is displayed in the map view with a default graduated color table.
Generate a hill shaded grid layer
  1. Select Modules | Terrain Analysis | Lighting | Analytical Hillshading.

    The Analytical Hillshading dialog box appears.

  2. Click the Grid system row. In the drop down list, select the newly imported elevation grid system, e.g. 1; 1085x 2699y; 289021.34x 4320943.205000y.
  3. Click the Elevation row. In the drop down list, select the newly imported elevation grid layer, e.g. 01.elev.


  4. Optional. Change the Shading Method, Azimuth, Declination and Exaggeration option values if necessary.
  5. Click Okay.

    The hill shaded grid layer is generated. By default the layer is named 'Analytical Hillshading'
Overlaying and Blending the elevation and hill shaded grid layers
  1. If the Data tree view is not displayed, then click the Data tab in the Workspace pane.
  2. Click the newly created hill shaded grid layer. Right click.

    A pop up menu appears.

  3. Choose Show Grid.

    The Add layer to selected map dialog box appears.

  4. Select the existing map view e.g. 01.elev to append the hill shaded layer together with the elevation grid layer in the same map view. Click OK.

    The hill shaded grid layer is displayed opaquely over the elevation grid layer.

  5. In the Data tree, select the hill shaded grid layer.
  6. If the Settings are not shown in the Options pane on the right, click the Settings tab. In the Transparency field, type in a percentage value e.g. 30.


  7. At the bottom of the right pane, click Apply.

    The hill shaded grid layer is displayed transparently and the underlying elevation grid can be seen.

Monday, August 9, 2010

Create intensity images from LAS files with SAGA GIS

In my exploration of SAGA GIS, I tried to create TIFF intensity images from LiDAR LAS files using SAGA GIS. I am pleased with the results and the process, which I shall describe in the following steps below. Like GeoMedia Grid, a LAS file has to be converted into an intermediate Point Cloud format. But the SAGA GIS process seems to have much less overhead than GeoMedia Grid's. Once the LAS file has been converted, the points can be interpolated into a surface using a Delauney Triangulation or other algorithms.

Conversion from LAS to Point Cloud
  1. Startup SAGA GIS.
  2. Select Modules | File | Shapes | Import | Import LAS Files.

    The Import LAS Files dialog box appears.


  3. Select the Input File row. Click the [...] button on the right. Browse and select a LAS file to import. Click Open.
  4. In the Attributes to import besides x,y,z list, toggle on intensity.


  5. Click Okay.

    The LAS file is imported into SAGA GIS.
    Note: it may be necessary to click the Data tab on the Workspace pane on the left to see the newly imported Point Cloud file.


Point Cloud Interpolation Using Delauney Triangulation
  1. Select Modules | Grid | Gridding | Interpolation from Points | Triangulation.

    The Triangulation dialog box appears.


  2. In the Points row, click the drop down list and select the previously imported LAS file point cloud data set.
  3. In the Attribute row, click the drop down list and select intensity.


  4. Click Okay.

    The User Defined Grid dialog box appears.


  5. Optional. Change any of the options e.g. Cellsize value to 1. Click Okay.

    The interpolated intensity grid is created.


Setting Greyscale colors
  1. In the Data tree, right click on the newly created grid file.

    A pop up menu appears.


  2. Choose Show Grid. Note: The Add layer to selected map dialog box may appear. Click OK.

    The intensity grid is displayed with the default color gradient.


  3. On the Options pane on the right, click the Settings tab. Select the Colors option of the Graduated Color option as shown below.


  4. Click the [...] button.

    The [CAP] Colors dialog box appears.


  5. Click the Presets button. Choose the Greyscale in the Preset Selection dialog box. Click OK.

    The [CAP] Colors dialog box is updated.


  6. Click Okay.


  7. Click the Apply button on the Options pane.

    The intensity grid display is updated with the greyscale color range.


Saving as TIFF
  1. In the Data tree, right click on the intensity grid.

    A pop up menu appears.


  2. Choose Save Grid as Image.

    The Save As Image dialog box appears.


  3. Browse to an output folder. Type in a file name. Choose Tagged Image File Format in the Save as type drop down list. Click Save.

    The Save Grid as Image dialog box appears.
    Note: toggle on Save Georeference to create the *.tfw world file. Toggle on Legend: Save to create the *_legend.tif file of the color legend.


  4. Click Okay.

    The intensity TIFF file is created.


    Below is an example of the resultant legend TIFF
    file.


Tuesday, August 3, 2010

Setup a custom color palette map legend for Global Mapper

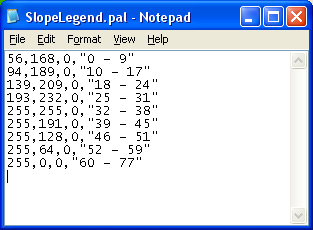
Sometimes it may be necessary to display a custom map legend in Global Mapper to help users understand the grid data displayed on the map, especially if the colors do not correspond to elevation data e.g. slope, aspect, weight, etc. The colors and the labels have to be manually defined either in a color palette file or interactively using the Global Mapper interface. I prefer to use a text editor to create the color palette file as described below. An example of how the color palette looks like in Notepad is shown below.


The first three numbers correspond to the RGB color values. The last column is the label enclosed in double quotes.
To use this custom color palette in Global Mapper, do the following:

  1. Start up Global Mapper. Load a non-elevation grid data, e.g. slope.asc.
  2. Select Tools | Map Layout.

    The Setup Map Layout dialog box appears.
  3. In the Map Legend group drop down list, choose Display Legend on Color Palette.

    The Setup Palette dialog box appears.

    Note: you can interactively define the colors and matching labels using the buttons or load in a previously created color palette file.
  4. Click Load Palette File. Browse and select an existing color palette file, e.g. SlopeLegend.pal. Click Open.

    The select color palette is loaded and displayed in the Palette list box.
  5. Click OK.
  6. In the Map Legend group's Header field, type in a meaningful Header e.g. Slope in Degrees. Click OK.

    The custom map legend is displayed in the map window.