This gadget will allow you to subscribe to the European-Mediterranean Seismological Center (EMSC) real-time, worldwide earthquake rss feed. It shows the latest 50 earthquakes as color coded (by depth and age) icons with tool tips on a Google Maps backdrop - the older the earthquake, the more transparent the icon will look.
The gadget has a list tab which displays the earthquake information as a text list with hyperlinks for more details - the list can be sorted by the earthquake magnitude, depth as well as the date-time. Using the list, you can easily find and locate the largest, the latest or the deepest earthquakes for the past day.
You can leave this gadget on the screen and it will update itself as it receives the latest feed. Upon receiving the data, it will automatically zoom to the latest earthquake epicenter. Clicking on an earthquake icon will bring up more information about the earthquake from the EMSC site.

About Geospatial Applications, Intergraph GeoMedia, FME, Visual Studio, gvSIG, Global Mapper, Programming, LiDAR, GIS, Google Maps, SAGA GIS, Android, QGIS
Monday, October 25, 2010
Monday, October 18, 2010
Batch plotting pdfs from GeoMedia Professional's BatchPlot Utility
Intergraph did not include the capability to plot PDF files from the BatchPlot utility of GeoMedia Professional. Instead Intergraph recommend users to make use of Adobe Distiller to automatically convert any plot files generated by BatchPlot in a watch directory into PDFs.
I have a couple of alternative methods to create PDFs in batch mode. One of the methods involve the use of a free PDF printer called PDFCreator and which I shall describe here. It can be downloaded from this web site. Here is the procedure to use PDFCreator to create PDF files from BatchPlot.
By default, the PDFCreator installer creates a virtual printer with the name PDFCreator. The printer is automatically configured to create temporary PDF documents from any print job submitted to it; and the user will have to manually save the PDF document to a desired name and location. If BatchPlot submits a lot of print jobs to the PDFCreator printer, then manual saving would be quite troublesome. So it would be better if we enable the Auto-Save feature for the PDFCreator printer and define an output print folder.
Configure PDFCreator
- Select Start | All Programs | PDFCreator | PDFCreator.
The PDFCreator - PDF Print monitor dialog box appears.
- Select Printer | Options.
The Options dialog box appears.
- On the list on the left side, select Auto-save.
- Toggle on Use Auto-save.
- Toggle on Use this directory for auto-save.
- Click [...] and select a directory.

- Ensure After auto-saving open the document with the default program is toggled off.
Note: by default, the PDF file is saved with the prefix {datetime}. I could not find a way to automatically name it from BatchPlot. So datetime is the best alternative. - Click Save.


Use BatchPlot to submit print jobs to PDFCreator
- On the Windows Desktop, select Start | All Programs | GeoMedia Professional | Utilities | Batch Plotting.
The Batch Plotting dialog box appears.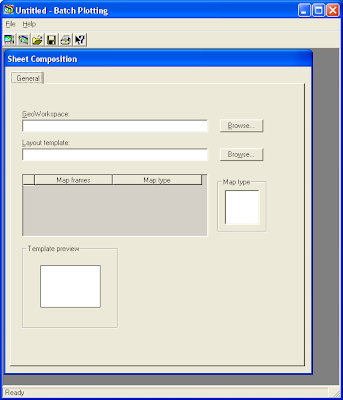
- Select File | Open. Browse and choose a saved Batch Plotting File e.g. batchPlot.gbp. Click Open.

- Select File | Print.
The Print dialog box appears.
- In the Name combo box, choose PDFCreator.
- Click OK.
BatchPlot submits print jobs to the PDFCreator printer.
The PDFCreator Print monitor shows the list of submitted print jobs.
Finally, the PDF files are created in the output directory.
The only problem with this method is that the PDF files must be renamed manually. Note that the plot order is in the same order as the order BatchPlot reads the map content features from the input warehouse - knowing this can help a little in renaming the files correctly.


Monday, October 11, 2010
Mosaic DEM grid layers using SAGA GIS
If an area of interest is covered by multiple digital elevation (DEM) model files, then it may be necessary to mosaic or merge the individual DEM files to create a single DEM grid layer. The Grid Merging command in SAGA GIS can be used to perform this task.
In this example, I will illustrate importing and merging a few SDTS DEM layers.
Importing SDTS DEM files
- Start up SAGA GIS.
- Select Modules | File | GDAL/OGR | GDAL: Import Raster.
The GDAL: Import Raster dialog box appears.
- Select the Files row. Click the Browse [...] button.
The Open dialog box appears.
- Browse and select a SDTS DEM file, e.g. 9903CATD.DDF. Click Open.
The GDAL: Import Raster dialog box is updated with the selected file. - Click Okay.
The SDTS DEM layer is imported. - Repeat steps 2 to 5 for importing the other DEM files of interest.


Displaying DEM files in one Map window
- In the Workspace pane on the left, double click one of the imported DEM layer.
The layer is displayed in a Map window. - Double click on another grid layer.
The Add layer to selected map dialog box appears.
- Choose the previously created Map window instead of New. Click OK.
The layer is displayed in the same Map window. - Repeat 2 to 3 for the remaining grid layers.
- Select Map | Zoom to Full Extent.
All the grid layers can be seen in the same Map window.


Merge the DEM layers into one
- Select Modules | Grid | Construction | Merging.
The Merging dialog box appears.
- Select the Grids to Merge row. Click Browse [...].
The Grids to Merge dialog box appears.
- On the list on the left, select all the grid layers to merge (while pressing down the CTRL button). Click the >> button.

- Click Okay.

- In the Target Grid combo box, choose create.
- If necessary, change the Preferred data storage type, Interpolation, or Overlapping Cells options.
- Click Okay.
The selected grid layers are merged.
- In the workspace pane, double click on the merged grid and display in a new Map window.


Thursday, October 7, 2010
Show Borneo R.S.O. (Timbalai) Coordinates Mapplet

Borneo Rectified Skew Orthomorphic (BRSO) on Timbalai datum is a map coordinate system commonly used in the East Malaysian states of Sabah and Sarawak, and the Sultanate of Brunei. This mapplet will display BRSO (Timbalai) easting, northing coordinates on Google Maps. As Google Maps are using the Mercator projection on WGS84 datum, the mapplet will perform a datum transformation from WGS84 to the Timbalai datum using the Standard Molodensky 3-parameters transformation. Then it will do a projection conversion from Mercator to RSO projection to get the BRSO (Timbalai) coordinates. The mapplet can also locate the position on the map given a BRSO (Timbalai) coordinates. To run the mapplet, just click on this link http://dominoc925-pages.appspot.com/mapplets/cs_brsotimb.html.
Tuesday, October 5, 2010
Show SVY21 Coordinates Mapplet

This Google Mapplet allows a user to click any point on the map and display the local Singapore SVY21 easting and northing coordinates. Alternatively, the user can type in a SVY21 easting, northing coordinate in a text box and locate the position on the map. To run the mapplet, just click on this link http://dominoc925-pages.appspot.com/mapplets/cs_svy21.html.
Monday, October 4, 2010
Deleting an attribute field from a shape file using Global Mapper
Sometimes I want to remove an attribute field from a shape file for some housekeeping reason. I could use Global Mapper to do the job. The workflow in Global Mapper is straightforward - basically you load in the shape file, select all the features, then edit and delete the field(s) you desired. Finally, the changes must be saved back to the original shape file. The steps in more detail are illustrated below.
- Start up Global Mapper. Load in a shape file, e.g. Incidents.shp.
- Click the Digitizer tool button.

- Press down and drag the left mouse button and select all the features.

- Press down the right mouse button.
A pop up menu appears.
- Choose Edit Selected Features.
The Modify Selected Point Features dialog box appears.
- In the Feature Attributes combo box, choose the attribute field, e.g. OCCURRENCE.

- Click Delete.
A confirmation prompt appears.
- Click Yes. Then Click OK.
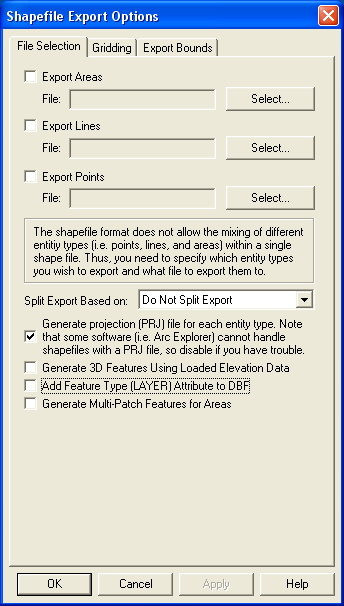
The attribute field is deleted from the features in RAM. - Select File | Export Vector Data | Export Shape File.
The Shapefile Export Options dialog box appears.
- Toggle on the geometry type, e.g. Export Points. Browse and select the original shape file, e.g. Incidents.shp.
- Click OK.
The changes are saved permanently.


Subscribe to:
Posts (Atom)
